Type "best trading bots 2026" into Google and count. The first ten results are listicles. Each has a different product at number one, and a green "Visit site" button beside every entry. Not one of the people who wrote them has traded a dollar through any of the software they ranked.
That is not a cynical read. It is the business model, and once you see it the first page of results becomes what it is: a sales floor with a table of contents.
Why every ranking you will find is worthless
A ranking means something only if the person doing it can measure what is ranked and has no reason to lie about the measurement. Trading bot lists fail both tests at once.
Start with measurement. To honestly rank ten systems you would need, for each, a performance record over the same period, on the same instruments, with the same costs applied. Almost nobody publishes that. Most publish a screenshot. Some publish a curve with no axis labels. A few publish nothing and lean on a Discord full of people posting green days and quietly deleting red ones. You cannot rank what nobody has disclosed, so the lists rank on the only inputs available: brand recognition, how slick the site looks, and the size of the check.
Then the incentive. The writer is not paid when you make money. They are paid when you click through and buy. The best results earn no boost; the highest commission gets the top slot, the biggest logo and the "Editor's Choice" badge. If you have wondered why the same three names lead every list on every site, that is why: those three run the most generous affiliate programs, not the best software.
Nobody ranks trading bots by results, because almost nobody publishes results. They rank by commission, because commission is the only number they can see.
There is no "best trading bot," and if there were, a listicle funded by referral fees would be the last place it turned up. Stop looking for the ranking and start applying a test. The same test to every candidate, including this one.
How the affiliate money actually moves
The numbers are neither small nor hidden: affiliate terms usually sit on the seller's own site, on a page buyers never open. A crypto bot on a monthly plan pays a partner 25% to 40% of the subscription, recurring, for as long as you keep paying. A prop firm pays roughly 10% to 20% of every evaluation fee sent its way, and evaluations get bought again after failures, which makes that stream larger than it sounds. A course or signal group commonly pays 40% to 50% of a one-time price that can reach four figures.
Now run the arithmetic from the writer's side. Ten thousand visitors a month, two percent click through, one in twenty of those buys: ten sales. At $60 a sale the page earns $600 a month; at a recurring 35% of a $99 subscription it becomes an annuity. Ranking A ahead of B can be a factor of five in revenue, and nothing pulls the other way: no reader ever comes back to complain that number two would have made them more money.
So the ordering is a pricing decision. Some pages admit it in a footer. Most say "we may earn a commission, this does not affect our reviews," which cannot be true, because the review is the product. The tells are in how to spot a trading bot scam in five minutes.
The five categories that actually exist
Before you evaluate anything, know what you are looking at. "Trading bot" covers five products with almost nothing in common. Comparing a crypto grid bot to a futures strategy is like comparing a scooter to a bus because both have wheels.
| Category | What you actually buy | Typical price | What you can verify first | How it ends badly |
|---|---|---|---|---|
| Retail futures system | A strategy file for a platform you run, usually NinjaTrader 8 | $500 to $3,000 once, or $50 to $150 a month | A backtest you re-run yourself | Logic fitted to the past unravels on new data |
| Crypto grid or DCA bot | A cloud service wired to your exchange by API key | $20 to $100 a month | Little: results live in the vendor's dashboard | One sustained trend stacks losses with no stop |
| Signal service | Alerts in a chat channel; you place every order | $50 to $300 a month | Nothing solid: exits get edited | Your fills and hesitation eat the edge |
| Copy or social platform | A link mirroring someone else's trades into your account | Free to join, paid via spread or profit share | A record you cannot audit | The trader changes size or style and says nothing |
| Institutional-grade | Execution infrastructure, colocation, research licenses | Six figures a year and up | Everything, with a legal team present | Not sold to you. This row is here for scale |
The last row matters more than it looks. When a landing page borrows institutional language ("hedge fund grade," "the technology quant desks use"), check whether what is sold is row five or row one in a costume. It is always row one. Pick your row before you pick a product; that single decision eliminates more bad options than any other filter. See automated trading and futures trading bots.
The eight things a serious bot has to show you
This is the replacement for the ranking. Clearing all eight guarantees nothing (nothing does), but failing three lets you dismiss a product in ten minutes.
| # | What to demand | Why it matters | What a failure sounds like |
|---|---|---|---|
| 1 | A backtest you can re-run on your own machine | Evidence, versus a picture of evidence | "Screenshots from our verified account" |
| 2 | The exact test period and total trade count | Fifty trades over eight months proves nothing | A curve with no dates and no trade count |
| 3 | Max drawdown in dollars, and the longest losing streak | Decides whether you can actually hold on | "Drawdown is minimal," with no figure |
| 4 | Win rate and average winner versus average loser | Either alone can look great while the system loses | "93% win rate" and nothing else |
| 5 | Costs modeled: commissions, and a word on slippage | Gross-to-net can remove a fifth of a thin edge | Results shown gross, costs never mentioned |
| 6 | Real stop orders placed with the entry | A mental stop is not a stop | "The algorithm exits at the optimal moment" |
| 7 | A clear answer on overnight exposure and gap risk | Held through the close is where accounts die | "We hold when the trend is strong" |
| 8 | Written terms: license scope, updates, refunds, support | You buy a relationship, not just a file | No terms page; support lives in a chat group |
Item one carries most of the weight. A strategy that runs inside a standard platform can be tested by you: load it into NinjaTrader 8, open the Strategy Analyzer, set the same instrument and dates, press Run, compare. If the numbers match, you have verified a claim instead of trusting a stranger. If a seller cannot offer that, ask why: the honest reasons are rare and specific, and the rest are excuses. See what a backtest is.
How to read a performance report without being fooled
Assume the report is real and nobody lied about a figure. You can still be badly misled, because reports are easy to present selectively. Four habits protect you.
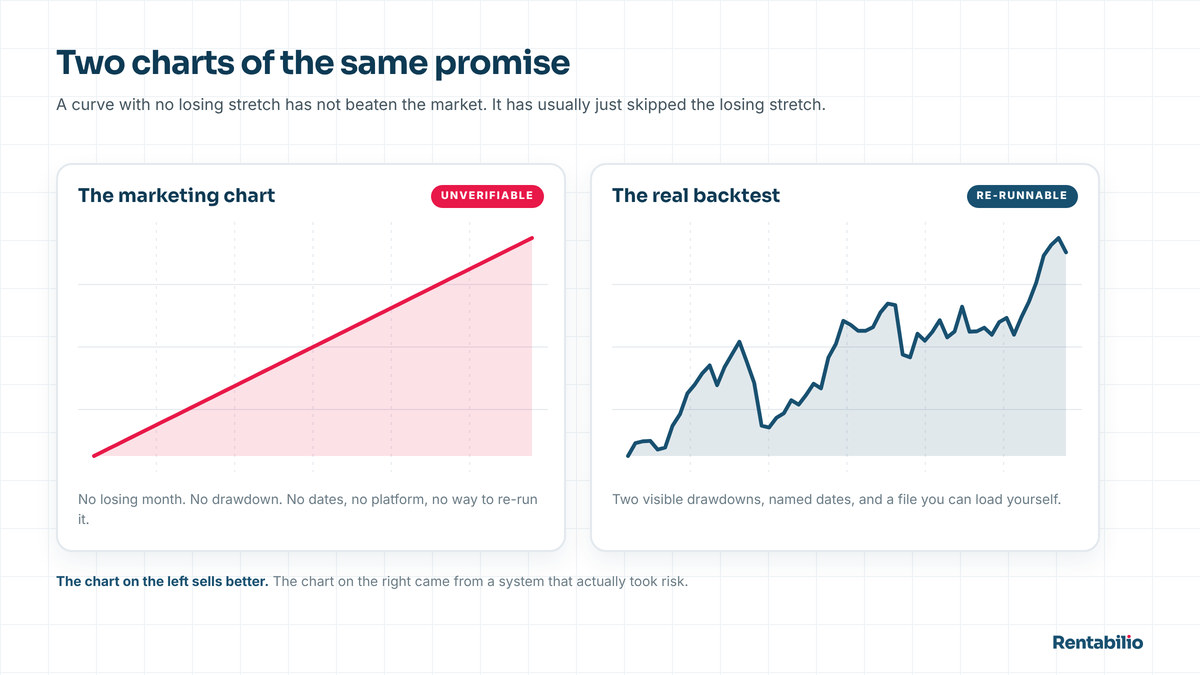
Distrust a smooth equity curve. A line climbing at 45 degrees with no visible dips did not come from a system that risks money on directional trades. It came from a martingale that has not met its bad day yet, from logic fitted so tightly to history that it memorized the answers, or from a chart drawn on monthly totals to hide the shape underneath. Real risk makes a jagged line, and the ugly stretches are the honest part.
Never read a win rate alone. A system that wins 93% of the time and loses ten units on the seventh trade is a losing system with good marketing. It runs the other way too: a system wrong more often than it is right is perfectly sound if the winners are bigger. Risk one to make two and breakeven sits at one trade in three. The arithmetic is in risk-reward and win rate.
Find the worst moment and sit in it. Take the max drawdown, the trades it took to recover, the calendar length of the stretch. Now put that in month two, before you have any cushion, with real money. If you would have switched it off, the system is wrong for you whatever its annual return: you would not have been there for the recovery. Start with drawdown, explained properly.
Ask what happened out of sample. Any strategy can be tuned until it looks perfect on the data used to build it; the useful question is what it did on data the developer had not seen when the rules were frozen. Overfitting is not exotic. It is the default result of optimizing without discipline, and it is why so many bots have a spectacular past and a dismal future.
88 months, 4,557 trades, the max drawdown and the losing months, plus the steps to reproduce it all in your own NinjaTrader 8. Hypothetical results from a simulation. Check them rather than trust them.
Six questions to ask before you pay anyone
Send these in writing. The answers matter, and so does the shape of the reply: two plain paragraphs is a different proposition from a testimonial video.
Question five separates people. A developer who has lived with a system answers it at once and in detail: quiet ranges, holiday sessions, days when the calendar is empty. Silence there means nobody has examined the thing they are selling.
What a fair price looks like
Price tells you nothing about quality. The pricing model tells you a great deal about what the seller is optimizing for.
A monthly subscription means the vendor earns whether or not the software makes you a dollar, and the incentive is retention: keeping you subscribed through a bad stretch matters more to them than the bad stretch ending. At $99 a month you pay $1,188 a year for something you never own. A one-time license means the vendor was paid once and must keep finding new buyers, which pulls toward marketing over maintenance; the mitigations to look for are a stated update policy and support that answers.
A free bot is never free. Somebody is paid: the broker whose rebate funds it, the exchange taking a slice of the extra trades the logic encourages, or the vendor upselling you once the demo has done its job. See free trading bots and what they actually cost. Reasonable ranges are $500 to $3,000 for a one-time futures license, $50 to $150 a month for a subscription with real support behind it. Above that you are funding the ads, not the code. Our numbers sit on the pricing page.
The licensing terms to expect
- Scope. How many machines, how many accounts. This matters if you plan to run one system across several funded accounts, which is what most people end up doing.
- Platform updates. NinjaTrader ships new builds, and an unmaintained strategy eventually stops loading. Ask whether updates are included, and for how long.
- Refunds. A written window with readable conditions. "Satisfaction guaranteed" in a headline is not a refund policy.
- What you do not get. Not source code: the logic is the product. You should get documentation good enough to know what the system does and when.
- Support. A channel producing a ticket with a reference number beats a chat group: a ticket is a record, a chat message is weather.
All of it should be readable before you pay, and so should the rules of whatever account you trade. If that is a funded account, you buy the evaluation from the prop firm yourself and pay the firm directly. No software vendor, this one included, hands you an account. See funded capital.
One system run against the checklist
Here is Rentabilio, the system sold on this site, put through the same eight points. Not as "the best" (that phrase is the problem this page is about) but as a worked example of what clearing the checklist looks like.
It trades US index futures on NinjaTrader 8 in a single window each day, at 8:30 AM ET, when US economic data lands and the pre-open starts moving with intent. On entry the stop and the target go into the market in the same instant, the target set at twice the risk. It never holds overnight. The mechanism is in how it works.
The published backtest covers more than seven years, 88 months day by day, on a $50,000 funded account: $274,406 gross, roughly $260,700 net after commissions of about 5% at approximately $1 per micro contract. That averages near $35,500 a year, about $2,900 a month, across 4,557 trades.
The part that matters more: it wins 46.2% of the time. It loses more often than it wins and is profitable anyway, because the average winner is $354 against an average loser of $193, a ratio of 1.84 and a profit factor of 1.58. The deepest drawdown across all 88 months was $4,379, and that is the number to sit with first. The last seven months of the test produced $43,322 gross, roughly double the historical monthly pace. A good stretch, and it should be read as one rather than as the new normal.
All of it is a simulation over historical data. No money was at risk producing those figures, and the steps to reproduce them are on the performance page. If your numbers do not match, that is a finding, and we would rather you had it.
Hypothetical performance. The figures above come from a backtest, not a live account. Simulated results are prepared with the benefit of hindsight, carry no financial risk, and cannot fully account for real execution, slippage or liquidity. Past performance, real or simulated, does not guarantee future results.
Frequently asked questions
Is there a genuinely independent ranking of trading bots anywhere?
Not one worth reading. An independent ranking would need verified, comparable performance records for every product in it, and most vendors publish nothing of the kind. What passes for a ranking is a list ordered by affiliate commission, usually admitted in the smallest type on the page.
What is the fastest way to disqualify a trading bot?
Ask for a backtest you can run yourself, and watch what happens. A vendor whose product is a strategy file for a standard platform can hand you exactly that, and you can confirm their published numbers in twenty minutes. One who offers screenshots, a dashboard on their own servers, or a chat room full of green days has told you what you needed to know without meaning to.
Does a higher price mean a better trading bot?
No, and the correlation may run the other way. High prices here usually fund a marketing funnel (ads, affiliate commissions, webinars) rather than better code, because those costs get recovered somewhere. Judge the pricing model instead: what you own afterward, what updates you get, and whether there is a written refund window.
Are crypto bots or futures bots the better place to start?
Regulated futures markets are easier to reason about: a central exchange, a public order book, standardized contracts and defined session hours, so a backtest resembles what happens live. Crypto adds exchange risk, fragmented liquidity, funding costs and a 24-hour clock, and most crypto bots are grid or averaging strategies surviving on the fact that a bad trend has not arrived yet. Neither is safe; one is far easier to verify.
Can I just try a few bots and keep whichever one works?
You can, and it is an expensive way to learn, because a short run of losses proves nothing and neither does a short run of wins. Switching after a bad month is how people buy every top and sell every bottom, at four vendors in a year. Pick one you have verified, decide in advance what would make you stop, and give it enough trades to mean something.