Where regulators require it, in Europe, the UK and Australia, brokers offering leveraged products must publish what share of their retail customers lose money. The answer comes back between 70% and 85% almost everywhere it is measured, across countries, brokers, bull markets and bear markets. That is the base rate you are starting from.
Most pages written for this search open by telling you how much money is out there. This one opens with the default outcome, which is a loss. The people who avoid it are not the ones who wanted it more, but the ones for whom a short list of things happened to be true. That list is the rest of this page.
What day trading actually is
Day trading means opening and closing positions in the same session, so you finish the day flat, holding nothing overnight. That is the whole definition. It is not a strategy, it is a holding period.
People choose it out of caution, not greed. A position held overnight is exposed to everything that happens while you sleep: an earnings release, a central bank in another time zone, a headline at 3:00 AM ET. Closed before the bell, it has a knowable worst case. The catch is that intraday moves are small, so making real money out of one takes leverage.
So the bargain is overnight risk swapped for leverage risk. Fine if you control size, ruinous if you do not.
Day trading is not a skill you acquire by watching charts until they make sense. It is the business of executing a plan that already has positive expected value. If you cannot state your plan so another person could follow it without you, you do not have one yet.
What would have to be true for you to be the exception
Beating a failure rate of 70% to 85% is not a matter of attitude. Four conditions have to hold at once, and all four are checkable before you spend anything.
Three of the four have nothing to do with market knowledge. Information is rarely the missing piece; execution usually is. The breakdown is in why most traders lose.
Stocks, options or futures, and why the PDT rule decides it
You cannot day trade "the market." You pick an instrument, and for a small US account that choice matters more than anything else you decide in your first year.
The reason is a rule most beginners meet the hard way. Under FINRA's pattern day trader rule, four or more day trades in a stock or options margin account within five business days (if they add up to more than 6% of your activity that week) get you flagged. From then on the account must hold at least $25,000 of equity, and if it drops below, your day trading is restricted until you top it back up.
A cash account sidesteps the rule, but then you wait on settlement between trades, which for a day trader means trading every other day. Futures sit outside the rule entirely, with margin set by the exchange rather than FINRA. That single fact is why so many small US accounts end up in index futures.
| Instrument | Minimum to day trade | Smallest unit of risk | What makes it hard |
|---|---|---|---|
| Stocks, margin account | $25,000 under the PDT rule | One share | The equity minimum, plus thousands of tickers every morning |
| Stocks, cash account | None | One share | Settlement delays make real day trading impractical |
| Options | $25,000 on margin | One contract, $50 to $500 | Price moves with direction, time and volatility. Three ways to be wrong |
| Micro index futures | No regulatory minimum; a few thousand dollars is realistic | One tick, $0.50 to $1.25 | Leverage is explicit. Sizing is your responsibility |
| Funded futures evaluation | ≈$100 for a 50k, paid to the firm | One tick, $0.50 to $1.25 | You trade a rulebook too: daily limits and drawdown floors |
Micro contracts are why the bottom two rows exist. A tick on the Micro E-mini S&P is worth about $1.25, so a ten-point stop costs $50 rather than the $500 it costs full size. The mechanics are in futures and micro contracts; the steps are in how to trade futures.
What it actually costs
The cost of day trading is not the platform fee. It is a stack of small fixed amounts that only matter relative to your average trade.
| Cost line | What it is | Realistic figure | Scales with |
|---|---|---|---|
| Platform | The software you trade from | NinjaTrader 8 is free in simulation, no expiry | Nothing |
| Market data | Real-time CME index futures prices | A modest monthly fee, set by the exchange | Nothing |
| Commission and fees | Broker, exchange and NFA fees | About $1 per micro contract, round turn | Number of trades |
| Slippage | The price you wanted minus the one you got | Variable, worst when the market moves fastest | Number of trades |
| Evaluation fees | Attempting a funded account | ≈$100 for a 50k, ≈$250 for a 100k, ≈$400 for a 250k | How often you fail |
| A VPS, if you use one | A server that keeps the platform running | A few dollars a month | Nothing |
| Your losing trades | The largest line by far | What you risked, times how often you are wrong | Position sizing |
That last row is the one beginners underweight. Shaving a dollar off commission will not save an account risking 5% a trade. The first four lines are in slippage and commissions; both routes are priced in how much money you actually need.
What an edge is, and why chart reading is not one
An edge is a statistical property, not a feeling of understanding: over a large number of trades, the average outcome of your rule is positive after costs. It fits on one line.
Expected value per trade = (win rate × average winner) − (loss rate × average loser) − costs.
Put real numbers in it. A system winning 46.2% of the time with an average winner of $354 and an average loser of $193 gives (0.462 × $354) − (0.538 × $193) = $163.55 − $103.83, roughly $60 a trade before costs. Those figures come from the Rentabilio backtest published here (a simulation over historical data, not a live account), and the point is the shape, not the size. A system that loses more often than it wins can still have positive expectancy, because the winners are bigger.
Now notice what "learning to read charts" hands you: a story about why price moved. No win rate, no average winner, no average loser, no sample size. It cannot go into that equation at all. Which is why people study for a year, become genuinely more knowledgeable, and still lose.
If you cannot write your edge as an equation with numbers in it, what you have is an opinion with a chart attached.
How win rate trades off against reward-to-risk is in risk-reward and win rate. At a 2-to-1 target you break even winning one trade in three, which is why serious systems chase the ratio rather than the hit rate.
Risk per trade, done with arithmetic
Position sizing is where beginners lose accounts a decent plan would have survived, and it is pure arithmetic. Work backward from the loss you will accept, not forward from the profit you want. The convention is 1% of the account per trade; for a beginner, half of that is better.
- Pick the risk in dollars. A $5,000 account at 1% risks $50 a trade. That does not change because you feel confident today.
- Measure the stop in ticks. Say the rule puts the stop 10 points away on the Micro E-mini S&P. At 0.25 points per tick, that is 40 ticks.
- Convert to dollars per contract. 40 ticks × $1.25 = $50 of risk for one contract.
- Divide. $50 allowed ÷ $50 per contract = one contract. Not two because you like the setup.
Then ask what a bad run costs. At $50 a trade, eight losses in a row is $400, or 8% of a $5,000 account. Unpleasant, survivable. At four contracts it is $1,600, or 32%, and you need a 47% gain to get back to even. Same system, same trades. The only thing you changed was size.
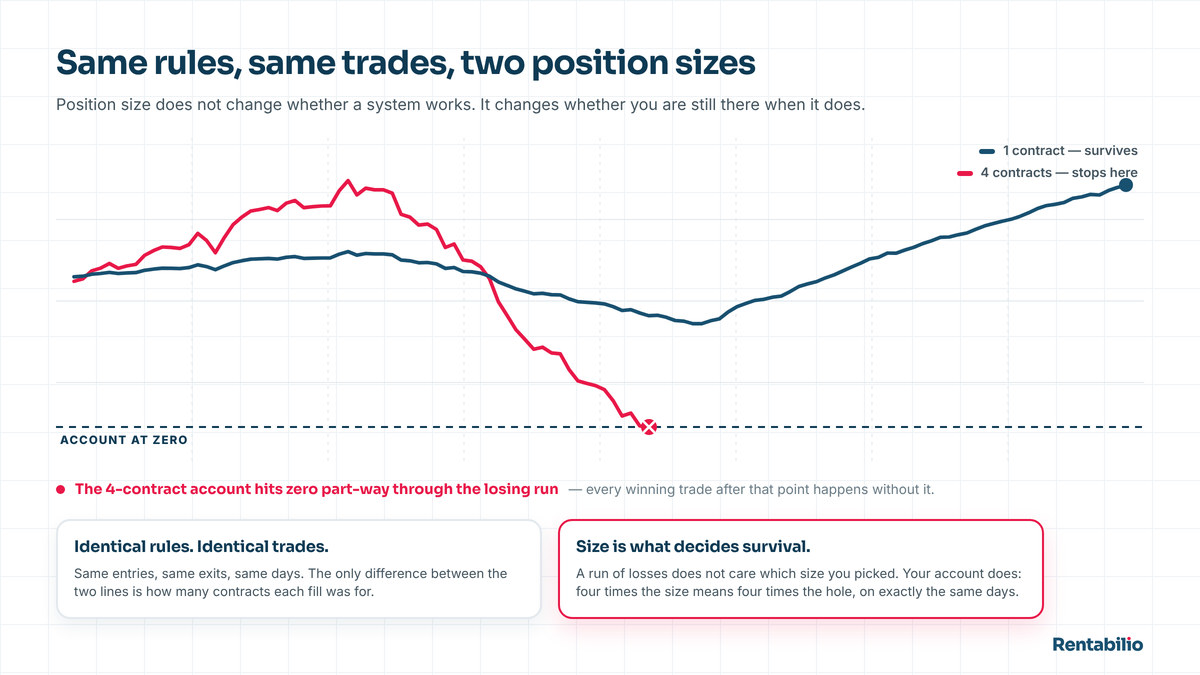
Eight losses in a row is not a malfunction. On a system wrong more often than it is right, it is ordinary arithmetic that turns up several times across a few thousand trades. That is drawdown, and planning for it separates a bad month from a closed account.
The psychology chapter, honestly
Most beginner guides tell you to be disciplined, which is like telling someone to be taller. What helps is knowing the specific failures, because each has a mechanical countermeasure.
Loss aversion. Losing $100 hurts about twice as much as gaining $100 feels good, a finding replicated for decades. In trading it means cutting winners early to bank the relief and holding losers because closing one makes the loss real. Small wins, large losses: the inverse of the equation above. The fix is placing stop and target in the market at the instant of entry.
Revenge trading. After a loss, the urge to win it back arrives disguised as determination. The next trade is bigger, on a worse setup, taken sooner. That is how a $50 loss becomes a $600 day. The fix is a hard daily stop, decided while you were calm: two losses and the platform closes.
The sunk-cost trap. "I have put six months and $3,000 into this, I cannot stop now." Both are gone whatever you do next. The only live question is whether the next dollar has positive expected value. The fix is writing your quit conditions down beforehand and treating them as binding.
Overconfidence after a streak. Four wins in a row feel like proof of skill and are usually variance. Size creeps up right before the run ends. The fix is sizing that changes on a schedule, off account balance, never off mood.
Each countermeasure removes a decision from you at the moment you are least fit to make it. Which is the argument for the second of the two routes below.
The calculator turns an account size, a risk per trade and a run of losses into dollars. Two minutes, and it changes what most people were about to do.
The two routes that actually exist
Strip out the marketing and a beginner has two honest paths. Both work, neither is quick, and they ask different things of you.
Build a discretionary method. Years in front of the market, in simulation and then at small size, until you have seen enough repetitions of one situation to know what it is worth. You journal, you tag every trade, and eventually you can state your edge in numbers because you measured it. People do this. It costs thousands of hours, and the attrition is the 70% to 85% at the top of this page.
Execute a tested rules-based system. Someone else did the research; your job is to verify it and then not interfere. The verification is the job: a backtest you can reproduce yourself, over years rather than months, with the losing stretches visible and the worst drawdown stated. Then you run it, which is where automation earns its place, not because a machine is clever but because it does not feel loss aversion at 8:31 AM ET.
Not a route: buying signals from someone whose record you cannot inspect, or copying a stranger whose rules can change without notice. The comparison is in best trading systems.
Hypothetical performance. The 46.2% win rate, the $354 average winner and the $193 average loser quoted here come from a backtest of Rentabilio over more than seven years of historical data, with no real money at risk. Simulated results are prepared with hindsight and cannot fully reflect real execution, slippage or liquidity. Past performance, real or simulated, does not guarantee future results.
A learning path that starts in simulation
Whichever route you pick, the order is the same. It is slow on purpose: every step you skip gets tested later, at a worse price.
- Weeks 1 and 2: the platform, in sim. Install NinjaTrader 8, connect the simulated feed, place orders until the mechanics are boring. Learn what a bracket order does and how to cancel one. Make your platform mistakes for free.
- Weeks 3 and 4: one instrument, one rule. Follow one written rule on one contract for twenty sessions. The point is not profit. It is finding out whether you can follow a rule when nothing is at stake. If you cannot, real money will not help.
- Month 2: measure. Count trades, win rate, average winner, average loser, and put them in the expectancy equation. Now you have a number, not an impression.
- Month 3: the smallest real size that exists. One micro contract, or one evaluation account you buy and pay for yourself. The only thing that changes between sim and live is you.
- Month 4 onward: judge by the quarter, against the plan's own history rather than your hopes.
A day-by-day version is in getting started in 30 days. If the funded route interests you, read prop firm trading first: those accounts carry a rulebook that can end an account whether or not your trading was any good.
Red flags in the education industry
This search term is one of the most heavily monetized phrases in finance, and the people selling to beginners know beginners cannot yet tell a real record from a screenshot.
- Screenshots instead of a record. A profit-and-loss image proves nothing. A backtest you can run yourself, on standard software, over a stated period, proves something.
- A monthly percentage. "10% a month" is 214% a year. No fund on earth compounds like that.
- The lifestyle as the proof. Cars, watches, rented villas. If the trading worked, the record would be the pitch.
- No drawdown figure anywhere. Every real system has a worst stretch, and a seller who never mentions theirs is hiding the one number that tells you whether you could hold on.
- Urgency and scarcity. Countdown timers, three seats left. An edge does not expire on Friday.
- Nobody mentions losing. The loudest tell of all.
Apply the test here too. The published Rentabilio backtest covers 88 months and 4,557 trades on a $50,000 funded account: $274,406 gross, about $260,700 net after commissions, a worst drawdown of $4,379, and a win rate under half. It is hypothetical performance over historical data, and the steps to reproduce it in your own NinjaTrader 8 are on the performance page. If the numbers did not reconcile you should be able to catch us. More tells: trading bot scams.
Frequently asked questions
How much money do I need to start day trading?
It depends on the instrument. Stocks or options in a margin account require $25,000 of equity under the pattern day trader rule. Futures have no such minimum, so the constraint is drawdown: the account must survive the worst losing run your plan can produce, which at micro size usually means a few thousand dollars. The funded route starts at roughly $100 for a 50k evaluation.
Can I learn day trading in three months?
You can learn the mechanics in three months: the platform, the order types, the contract specifications. Developing a discretionary edge takes years, because an edge is a statistical claim and statistical claims need hundreds of trades to mean anything. Executing someone else's tested system is faster, but only because the research is already done.
Is day trading gambling?
It is gambling when there is no measured edge, which describes most of what happens under the name. It is not gambling when there is a rule with positive expected value after costs, a size taken from the historical worst case, and enough repetitions for the edge to show. The difference is whether you can produce the numbers when asked.
Why do so many beginners lose money?
Rarely from a lack of information, which is free and endless. They lose on execution: cutting winners early, holding losers, raising size after a loss to win it back, abandoning the plan on the day it mattered. Add position sizes chosen from hope rather than arithmetic and the 70% to 85% figure stops being mysterious.
Should a beginner automate right away?
Automation removes execution failures but does not create an edge, so the answer depends on whether the rules being automated have a record you can verify. A bot running a bad plan loses money with perfect discipline. If you do automate, the work is checking the backtest: period, number of trades, worst drawdown, and whether you can reproduce it.
How long before I know whether this is working?
Longer than feels reasonable. A small edge is invisible over ten trades and obvious over a thousand, so judge by the quarter, against your plan's own history rather than a target you invented. If you cannot wait that long, that is useful information about whether the money you are risking is really money you can afford to lose.