Performance

The numbers, with the kitchen door open

This industry runs on screenshots nobody can check: a cropped profit figure, a curve with no axis, a number in a colored box. This page is the opposite. Below is the TSOPEN backtest exactly as the NinjaTrader 8 Strategy Analyzer produced it: on a $50,000 funded account, over more than 7 years, with commissions accounted for, and the exact steps to reproduce it yourself. These are hypothetical results from a simulation over historical data. No real money was at risk.

Tool:  NinjaTrader 8 Strategy Analyzer Account:  $50,000, micro contracts Results:  backtested, hypothetical
The curve

7+ years in one chart, uncropped

Cumulative profit from the first trade in the report to the last. The shape matters more than the end point: where it climbs, where it goes flat, and where it gives money back.
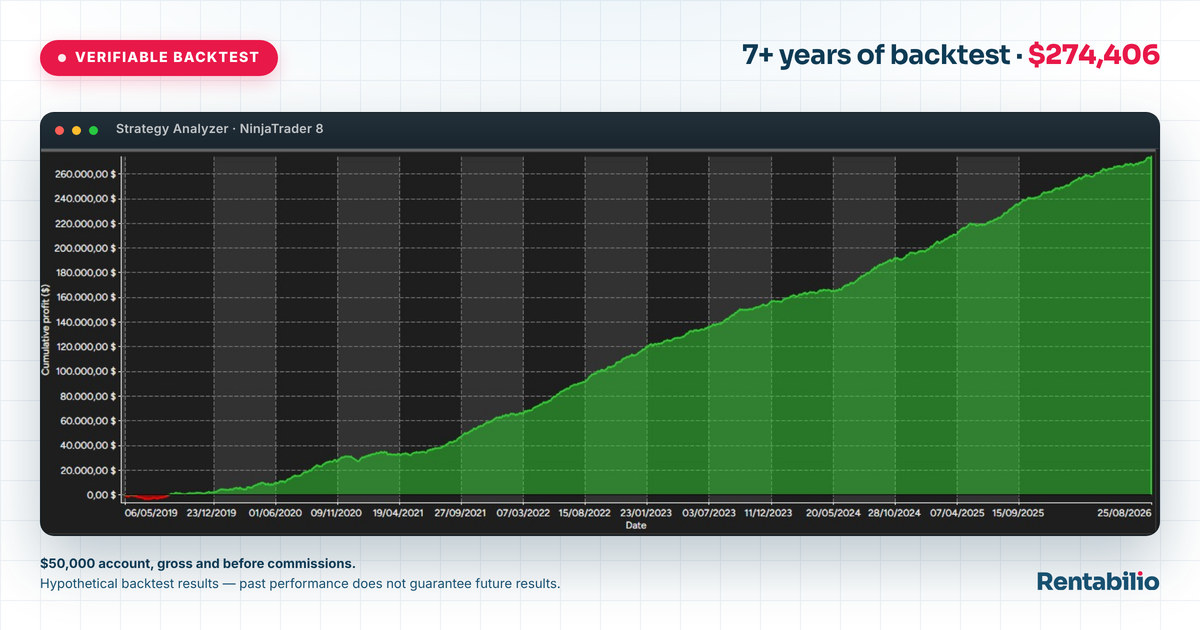
Cumulative profit curve of the TSOPEN backtest in the NinjaTrader 8 Strategy Analyzer, running 88 months on a $50,000 account and finishing at $274,406 gross

Strategy Analyzer output, gross and before commissions, on a $50,000 account. A simulation over historical data, not the record of a live account, and no real money at risk.

+$274,406Gross backtest profit over the whole period, before commissions
≈$260,700Net once commissions come out, about 5% off the gross
7+ years88 months of market history, run day by day
≈$35,500Average net per year across the period, commissions out
≈$2,900Average net per month across the same 88 months
4,557Trades in the report: a sample, not a lucky streak
46.2%Win rate. It loses more often than it wins, and still finishes up
$4,379Largest peak-to-trough drawdown, 8.8% of the account

The yearly and monthly averages are the backtest net divided by its period, nothing more. They are averages of a simulated past, not forecasts and not promises. Almost no month in the report actually looked like the average.
The report

The summary panel, number by number

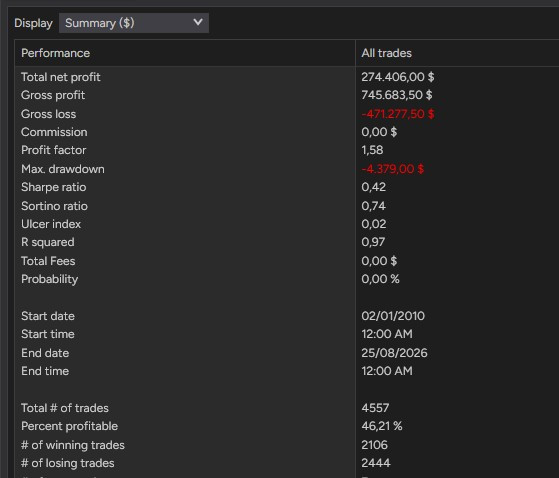
This is the box the Strategy Analyzer prints when a backtest finishes. It is the same box for every strategy anyone ever tests in NinjaTrader, which is precisely why we publish it instead of a graphic we designed ourselves. Here is what each line means, including the ones that are not flattering.

  • 4,557 trades. That is the number that makes the rest worth reading. Twenty trades is an anecdote; 4,557 spread over 88 months is a distribution, with good runs and bad runs inside it.
  • 46.2% winners. Read that again: the system loses more often than it wins. If you needed to be right most of the time to make money, this report would be a losing one.
  • Average winner $354, average loser $193. That is where the money comes from: about 1.84 to one. The 2:1 target and the stop placed with the entry are not decoration; they are the entire reason a losing win rate adds up. Here is that arithmetic in full.
  • Profit factor 1.58. Gross profit divided by gross loss: $1.58 made for every dollar lost. It is what that win rate and those two averages produce when you multiply them out. You can check it on the panel yourself.
  • Max drawdown $4,379. The worst peak-to-trough stretch in the whole run, 8.8% of the $50,000 account, published with its exact figure. A profit number without its drawdown next to it is half a sentence. What drawdown really measures.
  • Commissions: zero, in the report. The analyzer was run with commission set to 0, which is why we publish the net separately. At roughly $1 per micro contract the real result lands about 5% lower, near $260,700. We would rather say that out loud than let you find it later.
  • The start date on the panel is earlier than the curve. The analyzer was pointed at a longer range, but the usable data history begins where the chart begins. That is why the period we publish everywhere is the 7+ years (88 months) you can actually see in the curve, not the longer window in the header.
NinjaTrader 8 Strategy Analyzer summary panel for the TSOPEN backtest, showing $274,406 gross profit, 4,557 trades, a 46.2% win rate, profit factor 1.58 and a maximum drawdown of $4,379

The performance summary as the platform prints it. Same tool, same fields, same layout as any other NinjaTrader backtest you have ever seen.

The last stretch

The pace has been rising

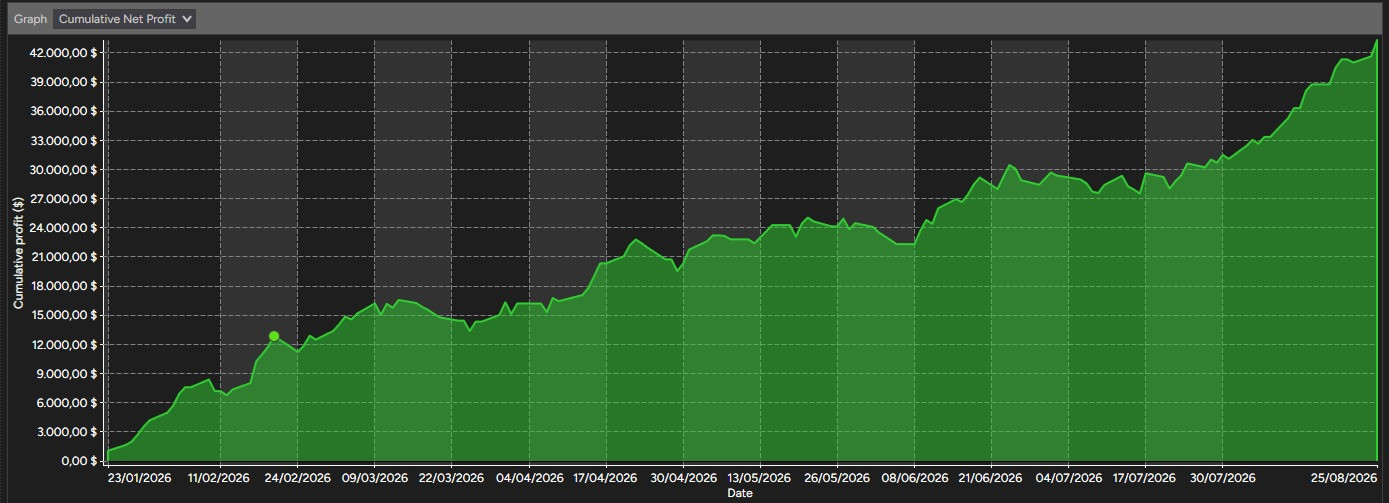
Look at the right-hand side of the curve and you can see it without being told: the line gets steeper. The last 7 months of the backtest produced $43,322 gross (about $41,200 net once commissions come out) on the same single $50,000 account, with the same rules and the same one window a day.

Divide that by 7 and you get roughly double the historical monthly average. We are not going to tell you why, because we do not know: more movement around the data releases is the obvious guess, and a guess is not a reason. Here are all three averages side by side.

≈$2,700Average net per month over the first 81 months
≈$2,900Average net per month across all 88 months
≈$5,800Average net per month in the last 7 months
Cumulative profit curve for the last 7 months of the TSOPEN backtest, rising to $43,322 gross on a $50,000 account

The same report, zoomed into its final 7 months. Gross, before commissions.

All three averages come from the same backtest, on the same account, with the same settings, so they are comparable with each other and with nothing else. This is the evolution of a simulated past. It is not a forecast, it is not a trend you can extrapolate, and a stretch that runs at double the average can be followed by one that runs at half. Anyone who shows you their best seven months and calls it the new normal is selling something.

Required, and meant

Hypothetical performance disclosure

Every figure on this page comes from a simulation. The wording below is the standard one, and we mean every line of it.

These are hypothetical, backtested results. They do not represent actual trading and no real money was at risk. Hypothetical performance has inherent limitations. Unlike the results shown in an actual performance record, these results do not represent actual trading: because the trades were not executed, they may have under- or over-compensated for the impact of market factors such as a lack of liquidity, order queue position or slippage. Simulated programs are also designed with the benefit of hindsight, since the person building them already knows how the period turned out. There are frequently sharp differences between hypothetical performance results and the actual results subsequently achieved by any particular trading program. No representation is being made that any account will or is likely to achieve profits or losses similar to those shown here. Past performance, whether actual or simulated, does not guarantee future results. Trading futures involves a substantial risk of loss and is not suitable for every investor; never trade money you cannot afford to lose. The long version, with everything else you should read before you buy, is on the risk disclosure page.
The fine print

What you are looking at, exactly

A backtest is only worth something if you know what was tested and how. So here are the settings behind every number above, in plain language.

  • Strategy. TSOPEN, running on US index futures inside NinjaTrader 8. No discretionary input anywhere in the run.
  • Account. Contract sizing matches a $50,000 funded account. On a larger account the system scales up, and the numbers scale with it. The calculator does that arithmetic for your size.
  • Commissions. The curve is gross: commission is set to zero in the analyzer. At about $1 per micro contract, the real result sits roughly 5% lower, which is the $260,700 net figure we publish next to it every time.
  • Period. 88 months, day by day, with nothing skipped: quiet weeks, bad weeks and the days the system stayed out are all in there.
  • Window. One per day, at 8:30 AM ET, enforced by configuration rather than by good intentions. Outside it the system does not look at the market. Why that minute.
  • Risk and target. Stop and target are placed automatically in the market at the same instant as the entry, with the target at twice the risk. Nothing gets widened afterwards.
  • Re-entries. The system can add contracts on defined pullbacks inside its window, which is why the analyzer sometimes counts several trades on one day. It closes everything before the window ends, and nothing is ever held overnight.
Do not take our word

Reproduce it yourself

Four steps, and not one of them asks you to trust a sentence on this page.

  1. Open NinjaTrader 8 It is free for charting and simulation. Install it, then go to New → Strategy Analyzer.
  2. Select the TSOPEN strategy With your license installed, it appears in the strategy list like any other. No license yet? The window and the report still work with the platform's own sample strategies.
  3. Set the same period and type The same 88 months, the same instrument, type Backtest, commission at zero if you want the gross curve.
  4. Hit Run, then compare You get your own summary panel and your own curve. Put them next to the images above. They should match, trade for trade.

Buyers get the exact settings (instrument, session template, parameters) in their account area, so there is no guessing about which configuration produced this report.

The other half

What these numbers are not telling you

A page that only listed the good parts would be the exact thing we are asking you not to trust. Three limits, stated plainly.

It is a backtest, not a live account

Every trade above was filled by a simulator against historical data, with the benefit of knowing how the period ended. A system tuned hard enough will always look good on the data it was tuned on. That is the trap, and it has a name. Overfitting and curve fitting explains how to spot it, in our numbers and in anyone else's.

The curve is gross

Commissions are set to zero in the report, so about 5% of that line is not yours: roughly $1 per micro contract, every round turn. On top of that comes slippage, the difference between the price the simulator gave you and the price a real order gets in a fast market. Both costs, worked out with real numbers.

It has ugly months

The beginning of the curve is red. There are flat stretches where months of work go nowhere, and a $4,379 hole to sit through at the worst point. And it is wrong more often than it is right, on 53.8% of its trades. Drawdown is the number that decides whether you can actually live with a system.

Your call

Clear numbers deserve a clear decision

You have the gross, the net, the win rate, the drawdown, the period and the steps to check all of it yourself. Run the numbers on the account size you would actually use, and if they make sense to you, the license is a single payment.

Something here does not add up, or you want a number explained before you spend a dollar? Ask us. It becomes a ticket with a reference and a person answers it.