Two systems, same instrument, same seven years of history. One made 40% more money. The other never lost more than half as much at its worst point. Which one is better?
There is no answer to that question without knowing who is asking. If you have $5,000 and a mortgage, the smoother one is better. If you are running a funded evaluation with a hard drawdown floor, the smoother one is not just better: the other one is unusable. "Best" is a property of the match, not of the system.
Why "best" is the wrong question
Every ranked list of trading systems has the same defect: it sorts on one number, usually total return, over one period, usually the recent past. That tells you which logic suited the last few years. It says nothing about whether those conditions persist, or whether you could hold on through the ugly part.
Systems mostly do not fail because their logic is wrong. They fail because the owner turns them off, and owners turn systems off for reasons that have nothing to do with the strategy: a drawdown deeper than expected, hours that clashed with a job, a position size that felt wrong at 2:00 AM, or account rules that closed it before the recovery came.
Pick on three axes, in this order: what the system does in the market conditions it hates, whether its schedule fits your life, and whether its worst historical stretch is one you could sit through without touching it. Total profit is the fourth question, not the first.
The families of system logic
Nearly every retail trading system belongs to one of five families. They are not products but bets about how price behaves, and each bet pays off in one kind of market and gets punished in another.
| Family | The bet | Eats | Starves in | Typical shape |
|---|---|---|---|---|
| Trend following | Moves persist longer than people expect | Sustained direction, expanding volatility | Chop and quiet ranges: many small losses in a row | Low win rate, large winners, long flat stretches |
| Mean reversion | Stretched prices snap back | Range-bound markets with stable volatility | A real trend or a regime break: losses cluster | High win rate, small winners, rare ugly losses |
| Breakout | A level, once cleared, keeps going | Volatility expansion after compression | Quiet markets full of false breaks | Moderate win rate, needs a fast stop |
| Opening range / session | The first move of a session sets its character | Sessions with a catalyst: data, the cash open | Holidays and no-news days | One or two trades a day, defined risk |
| Order-flow based | Aggressive versus resting orders reveal intent | Liquid instruments with a real central book | Thin books, fragmented venues, bad data | Short holds, very sensitive to data quality |
Read the "starves in" column twice. That is the column that decides whether you keep the system. Every family has a market that eats it alive, and none is defective for it: a trend system losing money in a range is doing exactly what it should, which is stay small until direction returns. How these rules get written into code is in algorithmic trading.
Every system starves somewhere
The trap is not picking the wrong family. It is picking a family whose starvation period you did not know about, and meeting it three weeks after you paid.
Mean reversion is where this bites hardest, because its statistics flatter it. A system that wins 70% of the time feels correct almost every day, right up until the market breaks out of the range it was fading and delivers, in one week, a loss larger than the previous four months of gains. Nothing malfunctioned. The bet simply lost.
A high win rate is not evidence of safety. It is a description of shape.
So the honest question about any system is not "how often is it right?" but "what does its worst case look like, and how often does that case show up?" Which is why the next section matters more than the headline profit.
The worst period matters more than the best
Any system's best stretch is a fact about the market, not about the system. Its worst stretch is what you have to live in, and the only part of the record that tells you whether you can own it.
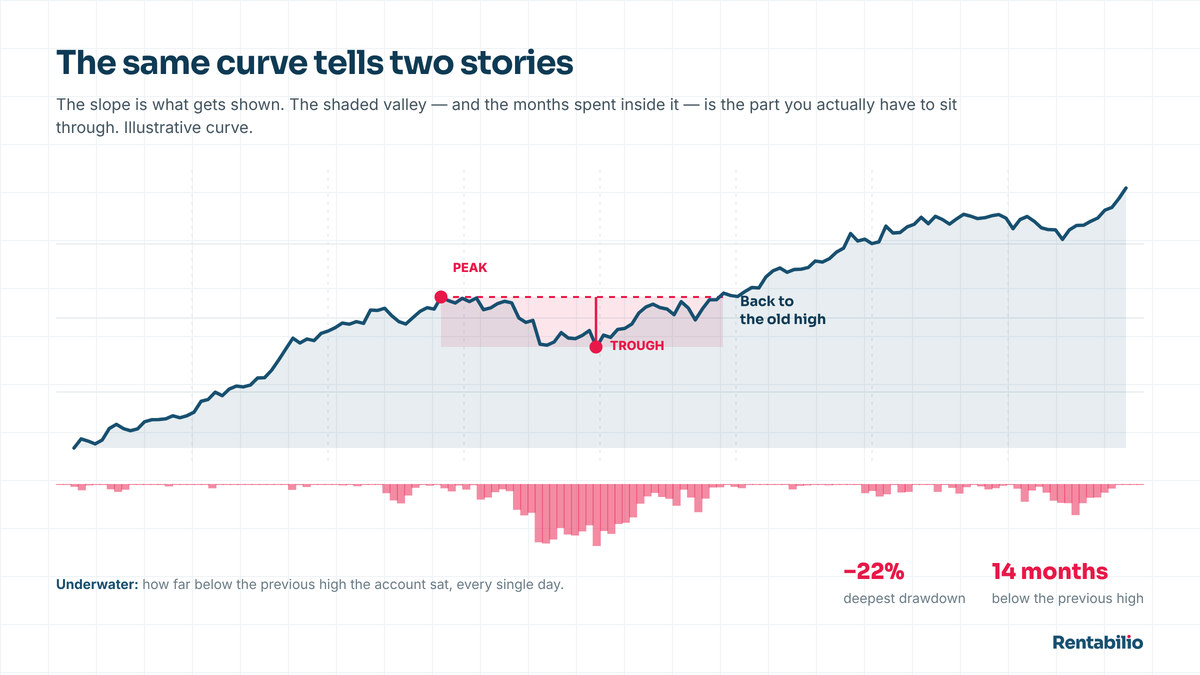
Three numbers describe that valley, and a seller who publishes only the first one is telling you a third of the story.
- Maximum drawdown in dollars. The deepest peak-to-trough fall in account value. In dollars, not percent, because percent hides how it feels on your actual balance.
- Time under water. How many months the account spent below its previous high. A $4,000 drawdown recovered in three weeks and the same $4,000 spread over eleven months are different experiences entirely.
- Longest losing streak. Consecutive losers. At a 46% win rate, six or seven in a row is arithmetic, not malfunction. It is also the moment most people switch the system off.
Then do the comparison that matters: put the maximum drawdown next to the average monthly profit. If the worst fall is eighteen months of average gains, you are buying a system you will abandon. If it is one or two, you have something you can hold. See what drawdown really is.
The metrics that compare two systems honestly
You cannot compare systems on profit, because profit depends on capital, contract size and period. These numbers survive being moved between accounts.
| Metric | What it answers | Realistic range | How it gets abused |
|---|---|---|---|
| Profit factor | Gross profit divided by gross loss | 1.3 to 2.0 on a large sample | Above 3 usually means a small or fitted sample |
| Win rate | How often it is right | Anything, on its own it means nothing | "87% winners" sold while the loser size stays hidden |
| Average win / average loss | The payoff shape | 1.5 to 2.5 for low win-rate systems | Scratching losers early flatters it until one full stop hits |
| Maximum drawdown ($) | The worst peak-to-trough fall | Compare it to monthly profit, not to the account | Quoted on closed trades only, ignoring open equity |
| Number of trades | Whether the sample means anything | Hundreds, ideally thousands | Forty trades presented as a track record |
| Costs deducted | Whether the result is real | Commissions and slippage, always | Gross equity curves with no fee assumption stated |
| Out-of-sample result | Does it work on data it was not built on | Present, and worse than in-sample | Simply omitted |
Two of these do most of the work. Profit factor tells you how much came back per dollar lost; average win over average loss tells you the shape of the ride. Together they explain the win rate instead of being explained by it: at a 2-to-1 payoff, breakeven sits near 33%, so a system winning 46% of the time is comfortably profitable and still loses more often than it wins. The arithmetic is in risk-reward and win rate.
Matching a system to your schedule
This is the axis people ignore and then quietly fail on. A system's trading hours are not a detail; they decide whether you can supervise it, whether you will be awake for the bad days, and whether it fits around a job.
- One window a day. A defined slot: for a futures trading bot, usually the 8:30 AM ET data release or the 9:30 AM ET cash open. Low trade count, low commission drag, and every trade drawn from the same conditions, so the backtest measures one repeatable situation instead of an average of five.
- All session. More trades and more sample, but more commissions, more exposure to conditions the logic was not built for, and no natural moment to look at it. Needs a machine that is always on.
- Overnight or multi-day holds. Better cost efficiency per trade, but you carry gap risk while you sleep, margin requirements go up, and funded-account rules frequently forbid it outright.
Decide the overnight question before anything else, because it changes what can go wrong. A system flat by the close cannot be hurt by an overnight headline. That is why Rentabilio trades one window a day at 8:30 AM ET and holds nothing overnight. The mechanism is on how it works.
Matching a system to your account size
The same system is a different product at different account sizes, because risk per trade is fixed in dollars while your tolerance is not.
Work it from the wrong end and it becomes obvious. If a system risks $50 per trade and its worst historical run was fifteen losses in a row, that stretch costs $750. On a $25,000 account it is noise. On a $2,000 account it is 37% of everything you have, and you will not still be running it at loss number nine. The system did not change. The match did.
In US index futures the ladder is usually set by the funded account tier: 50k runs one contract, 100k up to two, 250k up to five. The temptation is to take the maximum, and the arithmetic is unforgiving: five contracts multiply the profit and the drawdown by five, exactly. You buy that evaluation from the prop firm yourself and pay the firm directly, so the tier you pick is your own cost decision. The calculator puts your own numbers against a system's drawdown, and funded capital covers the tiers.
More than seven years day by day: 4,557 trades, a 46.2% win rate, a 1.58 profit factor and a $4,379 maximum drawdown, from a simulation over historical data, with the steps to reproduce it on your own machine.
What you can actually hold through
The third axis is the least measurable and the most decisive. You are not choosing a strategy; you are choosing an experience you will have several times a year.
Be specific with yourself before you buy. How would you feel about six consecutive losing days? About a month ending 4% down while the index went up? About a system that is right less than half the time by design? Those are not rhetorical questions: they are the working conditions of most systems worth owning, and your honest answer decides which family you should be shopping in.
If a losing streak would have you changing parameters, you want a high win-rate system with tight risk and you should accept its rarer, larger losses. If a single ugly week would break you but a slow grind would not, the opposite. Neither preference is wrong. Buying against your own preference is.
Buying a system versus building one
Both are legitimate. They cost different things, and the cost that matters is rarely money.
The hazard in building is that you are both author and judge: every parameter you nudge until the curve looks better is a small theft from your future results. See overfitting and curve fitting. The hazard in buying is that you cannot audit what you were not shown, which is why reproducibility is the only claim worth anything. Tooling is covered in the best trading software.
A fair evaluation, before you spend money
A process that takes an afternoon and rules out most of what is for sale.
- Write down what would make you say no. Before you look at the numbers, set your limits: maximum drawdown you would accept, minimum trade count, hours it must not trade. Deciding after you see a big profit is not deciding.
- Get the full report, not a summary. Trade list, monthly breakdown, drawdown, costs assumed. A seller who has only a screenshot of an equity curve has answered you.
- Reproduce it. Load the strategy into your own copy of NinjaTrader 8, set the same dates, run it, and compare. This one step cannot be faked, and it is why what a backtest is is worth understanding before you shop.
- Find the worst stretch and read it slowly. Locate the worst six months in the monthly table. Imagine living them in order. That is the product.
- Price the failure. If it does not work, what did you lose? Software cost, evaluation fees, months of time. Write the number down. It should be a number you can shrug at.
Reading one system all the way through
Here is what the whole process looks like applied to a single system, using published Rentabilio figures from a backtest over more than seven years: 88 months, day by day, on a $50,000 funded account.
It won 46.2% of 4,557 trades. The average winner was $354, the average loser $193, a payoff ratio of 1.84. That gives an expectancy per trade of (0.462 × $354) − (0.538 × $193) = $59.70, and $59.70 across 4,557 trades is roughly the $274,406 gross the report shows. After commissions of about 5%, near $1 per micro contract, that is ≈$260,700 net, about $35,500 a year, or $2,900 a month, on average.
Now the part that decides whether you could own it. The profit factor is 1.58: for every dollar lost, $1.58 came back. Maximum drawdown was $4,379, roughly a month and a half of average profit and about 8.8% of the starting balance. And it loses more often than it wins, so the ordinary daily experience is a losing day. In the final seven months of the test it produced $43,322 gross, about double its own monthly average, while consuming roughly seven funded evaluations, near $700 in fees paid to the firm. Good stretches cost money too.
Hypothetical performance. Every figure in this section comes from a backtest, a simulation over historical data, not from a live account. Simulated results are prepared with hindsight, carry no financial risk, and cannot fully reflect real execution or slippage. Past performance, real or simulated, does not guarantee future results.
Whether those numbers are good is not the point of showing them. The point is that all of them are on the table at once, including the ones that do not help. Any system you are considering should be presentable the same way. If it is not, you have learned something. The rest of the decision is on pricing and risk.
Frequently asked questions
What is the best trading system for beginners?
The one with the fewest decisions in it. A system with a single defined trading window, a fixed stop and target placed at entry, and no overnight positions removes almost every opportunity to make an emotional mistake. Total return matters far less at this stage than whether the worst month is one you can sit through, because the most common beginner failure is switching a system off during a normal losing stretch.
How many trades does a backtest need before I trust it?
Hundreds at minimum, thousands is better, because a small sample can be profitable by luck alone. Trade count also has to be read against the period covered: two thousand trades from six months of one market condition prove less than eight hundred spread across seven years of different conditions. Ask for both numbers, and check that the sample contains ordinary losing periods rather than one unbroken climb.
Is a higher win rate better?
Not on its own, and treating it as a quality score is how people end up with systems that produce steady small gains and occasional catastrophic losses. Win rate only means something alongside the average win compared to the average loss. At a 2-to-1 payoff, breakeven sits near a 33% win rate, so a system right 46% of the time can be solidly profitable while losing more often than it wins.
Can one system work on several markets?
Sometimes, but it has to be proven separately on each one rather than assumed. Instruments differ in volatility, tick size, session behavior and how they react to news, so a system tuned on the S&P is not automatically valid on the Nasdaq. If a seller claims many markets, ask for a separate report for each, since a blended result hides which one is carrying the others.
Should I run more than one system at a time?
It can smooth results when the systems belong to different families and genuinely lose money at different times, such as a trend system alongside a mean-reversion one. It does nothing if both are variations of the same bet, which is common when someone buys three systems from one seller. Diversification comes from uncorrelated logic, not from the number of products you own. Running several also multiplies the fees.
How long before I know a system stopped working?
Longer than feels comfortable, and the answer comes from the system's own history rather than from your patience. If its backtest contains stretches of six losing months, then six losing months is normal behavior and not evidence of anything. The signal to stop is behavior outside that historical range: a drawdown deeper than any it recorded, or a win rate far below its documented level over many trades.