A bad week, on its own
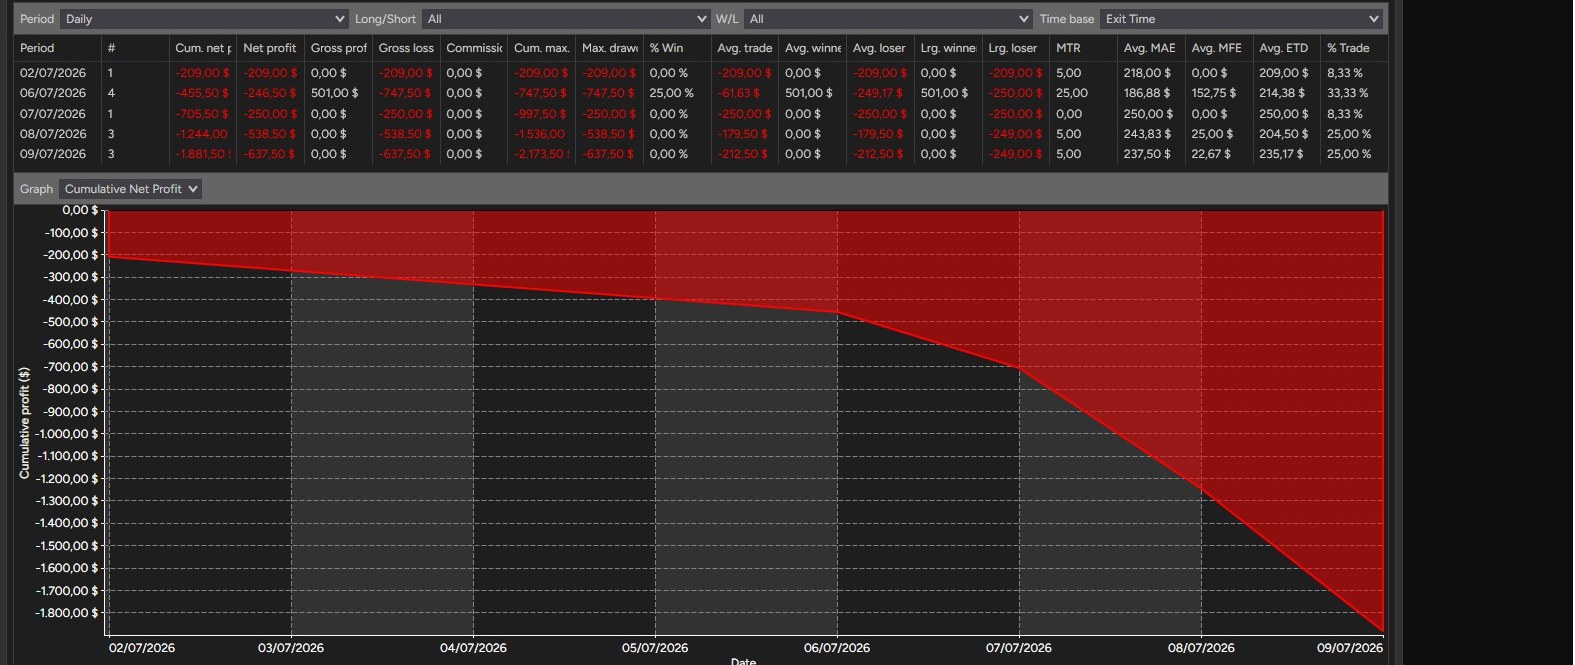
One week in isolation. Every session red, the curve going one way, down to about −$1,800. No context, no before, no after.
This is the screen that makes people switch the system off.
Every system of this kind goes through red stretches. Days in a row that lose, a week that ends down, a chart that looks like a mistake. That is not a malfunction: it is what a strategy that loses more often than it wins looks like from close up. Zoom out and the picture changes completely, because what does the work here is not any single trade, it is the arithmetic repeated hundreds of times.
Both of those things are true at the same time, and the second one is the reason most people never get to the first. So here are the figures before anything else, and then exactly what the bad stretches look like.
Red days exist. Losing weeks exist. They are inside both of the numbers above, all the way through, and they did not stop the total from climbing. A system that wins 46.2% of its trades is wrong more often than it is right by design, so stretches in the red are not a fault in it. They are one of its normal states.
That is the thing worth understanding before you look at any chart: the losing weeks and the $274,406 are the same story, not two different ones. What follows is the same simulation seen from three distances, so you can watch a bad week turn into a detail.
The three charts below are the same backtest in the NinjaTrader 8 Strategy Analyzer. Same trades, same system, same simulation. The only thing that changes from one to the next is how much of the period you are looking at.
One week in isolation. Every session red, the curve going one way, down to about −$1,800. No context, no before, no after.
This is the screen that makes people switch the system off.
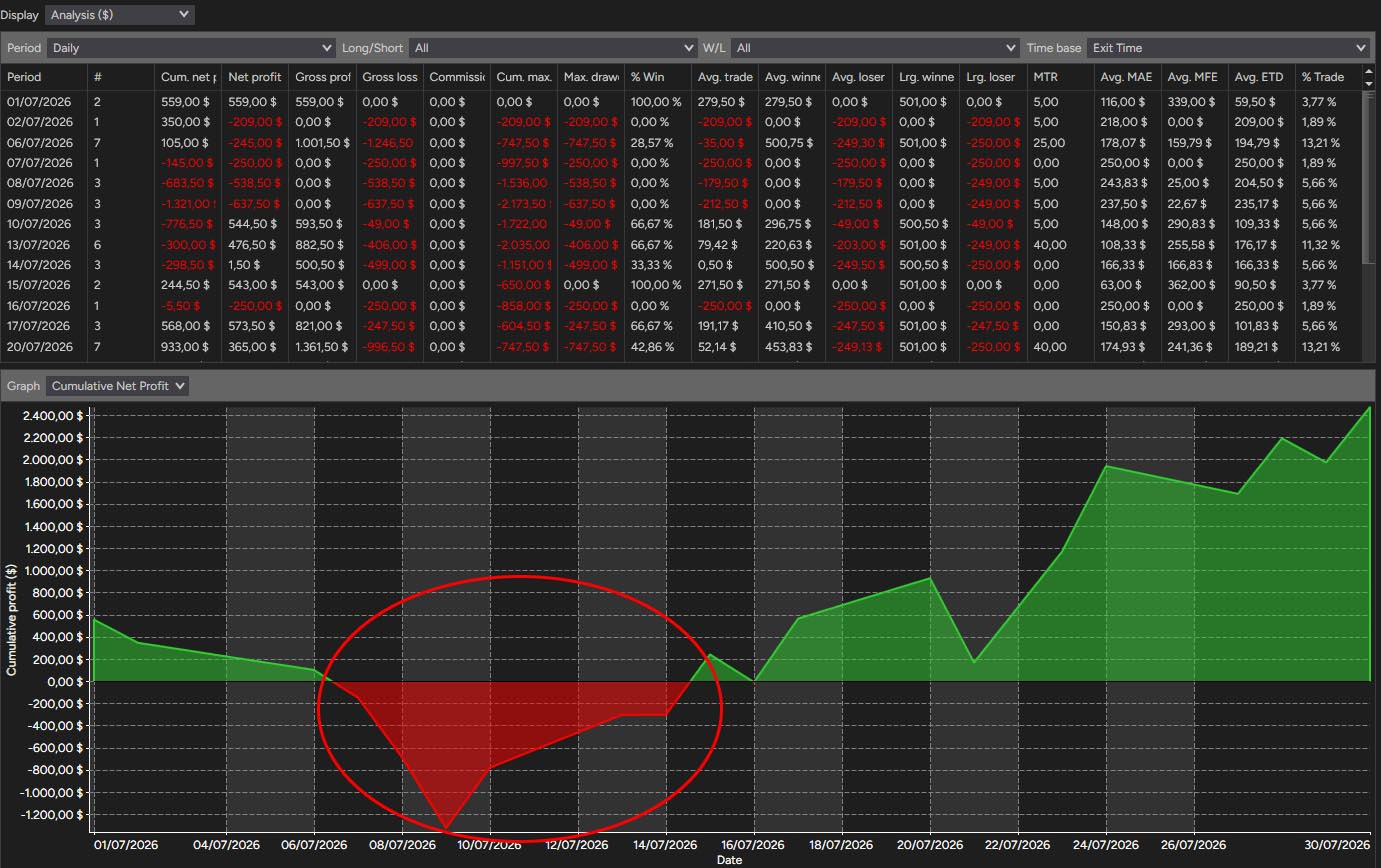
Now with the rest of the month around it. The circled part is exactly the week you just saw. The curve recovers and ends the month at a new high.
Nothing was fixed in between. The same week simply stopped being the whole picture.
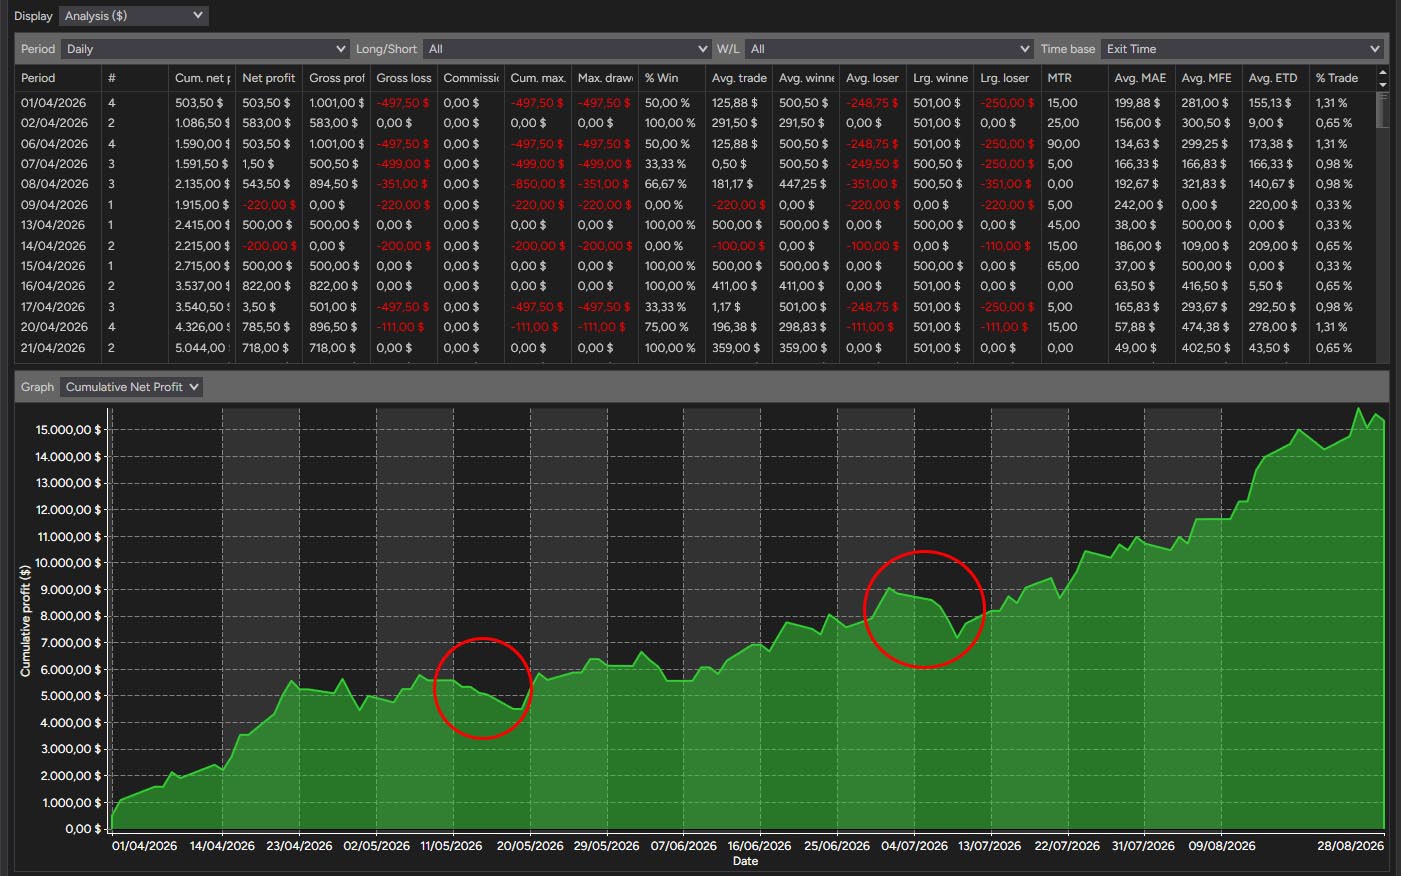
Five months of the same simulation. The episode from the first chart is one of the small circled dips, and there are others. The curve keeps climbing through all of them.
Same trades. Same system. Only the window changed.
That is the whole point. The losing week is still in there, and living through it feels exactly as bad at every zoom level. What distance tells you is that a stretch which fills the entire screen for five days is a rounding error in the period that actually produces the result.
Hypothetical performance. All three charts are backtests of Rentabilio in the NinjaTrader 8 Strategy Analyzer over historical data, not the record of a live account. No real money was at risk. Simulated results are prepared with hindsight and cannot fully reflect real execution, slippage or liquidity. Past performance, real or simulated, does not guarantee future results. The canonical figures for the full period are on the performance page.
There is no mystery in why this works over time, and no promise in it either. It is one small statistical advantage, applied the same way every day.
The system takes one operation a day, in a single window, with the stop and the target placed in the market in the same instant as the entry. The target sits at twice the risk. That single design choice is what makes a losing majority survivable:
| What happens | Ten operations, illustrative |
|---|---|
| It is wrong more often than it is right | 6 losers |
| Each loss is capped by a stop set at entry | 6 × 1 unit of risk lost |
| Each win aims at twice that risk | 4 × 2 units of risk gained |
| Result of being wrong most of the time | +2 units |
That table is illustrative arithmetic, not the report. In the actual backtest the win rate is 46.2% and the average winner and loser come out at $354 and $193, a ratio of 1.84 after the real world takes its cut through partial fills and slippage. The shape is the same: most trades lose, and the total still climbs, because winning trades are worth more than losing ones.
Once you accept that, the red stretches stop being surprising. If roughly half of your trades lose, then runs of consecutive losers are not bad luck, they are a statistical certainty that shows up regularly. Flip a coin fifty times and you will see a run of five heads without anything being wrong with the coin. The equivalent run in a trading system is a week in the red, and the arithmetic that produced $274,406 gross over 88 months in simulation had many of them inside it.
A losing week is not evidence against the system. It is one of the things the system was measured across.
The place to look instead is the drawdown. The worst peak-to-trough fall anywhere in the backtest was $4,379, about 8.8% of the $50,000 account being modeled. That is the yardstick worth keeping: while the behavior stays inside the envelope the history already contained, nothing new is happening. The honest treatment of the downside is on the risk page, and what a drawdown actually is in plain terms.
Change the account size, the number of contracts and the commission rate, and see what the same backtest looks like on your numbers instead of ours.
An advantage of this kind pays out through repetition. Interrupt the repetition and you are no longer running the system that was measured.
Here is the uncomfortable mechanism, stated plainly. A drawdown is not a random pause, it is the part of the curve that the recovery is attached to. When somebody switches the system off on the worst day of a red stretch, they keep every loss that got them there and give away the rebound that the historical result depended on. Then they switch it back on after the recovery, in time for the next drawdown. Done twice, that alone turns a positive expectancy into a negative account.
This is why the answer to a bad week is boring: do nothing. Not out of blind faith, but because the decision was already made when you chose the size you trade. The choices that actually matter come before the system is running, not during a losing stretch:
None of this makes a losing stretch pleasant, and we are not going to pretend otherwise. It makes it expected, which is a different and more useful thing. The full picture of how the system decides anything is on how it works, and the arithmetic of what it produced in simulation is on performance.
We build and publish the software and the numbers behind it, and we make the backtest reproducible so you can check it rather than trust it. What happens on your machine and in your account is yours.
The complete version of all of this, including the standard hypothetical performance disclosure, is on the risk disclosure page. It is worth the five minutes before you connect anything to money.
Yes, and it is built into the model rather than being a sign that something is broken. The published backtest wins 46.2% of its trades, which means it loses more often than it wins, and a run of losing days inside that is ordinary arithmetic. What makes the result positive over time is that the target is twice the risk, so the winners are larger than the losers. A week is far too small a sample to tell you anything about a system that took 4,557 trades to produce its numbers.
Think in months and in numbers of trades, not in days. The figures published on this site come from 88 months and 4,557 trades. A month or two is still a small window in that context, and any short stretch can land far above or far below the average. If you need a single yardstick, use the maximum drawdown of $4,379 in the backtest: while the behavior stays inside that envelope, the system is doing what it did historically.
Switching it off in the middle of a normal losing stretch. It is the one decision that reliably converts a working system into a losing account, because you take the drawdown and then miss the recovery that the historical result depended on. The software removes the temptation to meddle trade by trade, but the decision to keep it running is yours, and that is where most failures happen.
No. Everything published here is a backtest, which is a simulation over historical data prepared with hindsight and with no money at risk, and real accounts frequently differ sharply from simulated ones. Past performance, real or simulated, does not guarantee future results. The reason we publish the numbers is that you can reproduce them yourself in NinjaTrader 8, not because they predict anything.
The machine and the connection. You are responsible for a stable internet connection, for your market data feed staying connected, for handling reconnections and platform restarts, and for the general upkeep of the computer or VPS the system runs on. Those are the everyday things that interrupt an automated strategy, and none of them are under our control. Rentabilio accepts no liability for trading losses of any kind.
The full report, the drawdown, the losing stretches and the steps to reproduce it in your own NinjaTrader 8 are on one page.